Sector rotation analysis: how it works for swing traders
An explainer on sector rotation analysis for swing traders—understand capital-flow drivers, relative-strength measurement, regime vs cycle context, practical data proxies, and execution rules for entries, exits, and beta control.
Sector rotation analysis: how it works for swing traders
An explainer on sector rotation analysis for swing traders—understand capital-flow drivers, relative-strength measurement, regime vs cycle context, practical data proxies, and execution rules for entries, exits, and beta control.
If you’ve ever bought the “strongest” sector only to watch leadership flip a week later, you’ve seen the hard part of rotation: it’s not a calendar—it’s a capital-flow auction.
This explainer shows you how sector rotation actually works for swing trading: how to measure relative strength without fooling yourself, when the business-cycle playbook breaks, which sector proxies and lookbacks are usable, and how to turn rankings into a rotation board you can trade with clear entries, exits, and risk controls.
Rotation’s engine
Sector rotation is the habit markets have of promoting one group of stocks, then demoting it. For swing traders, it’s not a story. It’s visible in relative charts like “XLF vs SPY” flipping from rising to falling.
Flows create the repeat. The same macro inputs push expected profits and discount rates around, so leadership and laggard behavior shows up on daily and weekly timeframes.
Capital flow logic
Money moves because the market keeps repricing two things: future cash flows and the rate used to discount them. When growth, inflation, rates, or risk appetite shifts, sectors respond differently, like “Utilities act like bonds” while “Semis act like growth.”
Cyclicals tend to benefit when growth expectations rise. Defensives tend to hold up when recession odds rise.
Watch the macro driver that changed. That’s usually the sector leader’s fuel.
Relative strength math
A sector can be up and still be losing leadership. A simple ratio chart, like XLK/SPY, tells you who is winning the race.
Rising ratio means outperformance. Falling ratio means underperformance.
Once a ratio trend starts, it often persists. Mandates chase winners, quants rebalance, and momentum traders add pressure.
Your edge is seeing the turn early. The ratio turns before the headlines.
Swing trader edge
Swing traders aren’t predicting the economy. You’re exploiting the market’s tendency to keep rotating for days, not hours.
- Ride multi-day sector drift after a breakout
- Fade extremes after blow-off relative strength
- Switch leaders when ratios roll over
- Use tighter stops than investors
- Recycle capital faster than buy-and-hold
Shorter cycles let you take more shots. You’re trading the rotation, not marrying it.
Cycle vs reality
Textbooks show clean sector handoffs as the economy moves through tidy phases. Trading screens show something else: overlaps, head fakes, and “late-cycle” moves inside an expansion. You use the template to form a prior, then you trade what prints.
Business-cycle template
Use this map as a probabilistic baseline, not a switch you flip at a date on a calendar.
| Phase | Typical leaders | Typical laggards | Common tailwind |
|---|---|---|---|
| Early | Consumer Discretionary, Financials | Staples, Utilities | Falling rates |
| Mid | Industrials, Technology | Utilities, Staples | Strong earnings |
| Late | Energy, Materials | Discretionary, Financials | Inflation pressure |
| Recession | Staples, Utilities, Health Care | Energy, Industrials | Risk-off flows |
The edge comes from spotting when price action refuses to follow the map.
Why templates fail
Rotations get messy when the driver isn’t “growth vs slowdown,” but something sharper and faster.
- Absorb exogenous shocks that reprice inputs overnight
- React to policy regime shifts that flip duration sensitivity
- Track index composition changes that rewrite sector beta
When the driver changes, yesterday’s sector logic becomes a trap.
Regime identification
You can infer regime from a few live gauges, instead of arguing about the cycle label. Watch rates for duration pressure, credit spreads for stress, the dollar for global liquidity, and volatility for risk appetite.
If those four agree, you have a tradable regime; if they conflict, trade smaller and faster.
Data and proxies
Sector rotation lives and dies on what you call a “sector.” If you swap XLF for financial futures, or an equal-weight basket, your leaders can flip overnight. Proxy choice changes your signal because each vehicle bakes in different holdings, rolls, fees, and rebalance rules.
Sector vehicles
Different vehicles track “the same sector” but behave differently in swings.
| Vehicle | What it represents | What it misses | Swing-trading gotcha |
|---|---|---|---|
| Sector ETF | Cap-weight equities | Pure-play exposure | Holdings drift changes |
| Futures (index) | Broad equity beta | Sector purity | Roll and basis noise |
| Custom basket | Your chosen names | Full sector breadth | Rebalance creates churn |
| Equal-weight ETF | More mid-cap tilt | Mega-cap leadership | Rebalance adds mean-revert |
Pick the proxy that matches your trade thesis, not the label on the chart.
Granularity tradeoff
Industries usually rotate before the sector ETF shows it. Semis can lead tech while software lags, and XLK looks flat.
Use sectors for fast screening and regime context. Drill into industries when dispersion is high, your “sector” signal looks noisy, or one mega-cap is dragging the whole proxy.
If one stock can move the proxy, you’re trading concentration risk, not rotation.
Lookback alignment
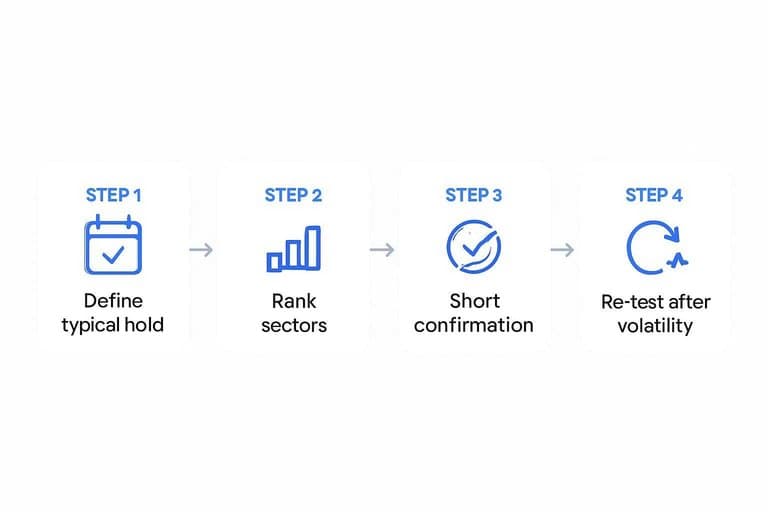
Match your measurement window to your holding period.
- Define your typical hold, like 5–20 trading days.
- Rank sectors with the same lookback, like 10- and 20-day returns.
- Add a shorter confirmation window, like 5 days, for turn detection.
- Skip 3–12 month lookbacks for swing entries unless you trade pullbacks.
- Re-test after volatility shifts, because optimal windows move.
Mismatched horizons manufacture “leaders” that already finished their move.
Rotation measurement toolkit
You need a few mechanical reads to avoid vibe-based rotation calls. Focus on trend, acceleration, breadth, and risk-adjusted leadership, then act only when they align.
Relative strength ratios
Ratios isolate leadership by comparing a sector to a benchmark, not to cash. You care about the slope because slope is money.
- Divide sector ETF price by benchmark price (e.g., XLK / SPY).
- Plot the ratio and add a 20- and 50-day moving average.
- Read leadership when the ratio is above MAs and rising.
- Flag regime change when the ratio breaks the 50-day and rolls over.
- Use the ratio, not price, for entries and exits.
Ratios strip out a lot of market beta, so your “leader” isn’t just “went up with SPY.”
Momentum vs mean reversion
Use momentum when rotation is persistent and flows are one-way. Use mean reversion when moves are stretched and liquidity is thin.
1–3 month momentum works in clean trends, especially after breakouts and earnings revisions. Short-term reversion works after gaps, ETF rebalance days, and crowded factor unwinds.
Crowding and microstructure create snapbacks because everyone exits through the same narrow door.
Breadth internals
Price can rise on a few mega-caps while the rest of the sector rots. Breadth tells you if leadership is actually spreading.
- Track % of names above 20/50-day MAs.
- Track advance/decline line within the sector.
- Track new 20-day highs vs lows.
- Track equal-weight vs cap-weight performance.
- Track up-volume vs down-volume.
When breadth turns first, rotation is graduating from a trade to a regime.
Volatility adjustment
Comparing sectors without volatility control is a trap. Your “same-size” trades are not the same risk.
Use ATR or realized volatility to normalize position size and to compare trends on a risk basis. A simple rule works: size positions so each sector risks the same ATR multiple.
Equal-dollar bets quietly overweight high-vol sectors, so your rotation call becomes a volatility bet.
Building a rotation board
A rotation board is a simple dashboard that tells you what’s leading, what’s fading, and what’s just noise. You use it to rank sectors, spot leadership shifts early, and avoid churn when “everything looks tradable.” One good board can replace five scattered charts and a lot of second-guessing.
Ranking framework
You want one number per sector, but you don’t want one brittle indicator driving decisions. Composite scoring keeps you from betting everything on a single ratio wiggle.
- Score ratio trend versus SPY
- Score momentum change rate
- Score breadth participation strength
- Score volatility regime and expansion
When two inputs disagree, you get a warning, not a false signal.
Transition detection
Leadership changes rarely announce themselves on price first. Internals usually crack before the chart looks “obvious.”
- Track sector/SPY ratio MA cross for direction flips.
- Flag momentum rollover from higher highs to lower highs.
- Watch breadth divergence when price rises on fewer names.
- Confirm with volatility expansion after a quiet run.
If internals shift while price still behaves, you’re early instead of late.
Timeframe stacking
Daily signals get you entries, but weekly context keeps you from trading every blip. Use the weekly trend as a filter, then take daily setups only when they agree.
Example: if XLK is strong on the week but dips for three days, you treat it as a pullback, not a breakdown. That one constraint cuts most whipsaws without starving your trade list.
Trade execution mechanics
Sector rotation only pays when your view turns into an executable bet. You need entries tied to a ratio, not vibes, like “XLK/SPY breaks above last month’s high.” Sectors also trend smoother than single names, until correlation snaps and everything re-prices fast.
Entry archetypes
Two setups cover most swing trades in rotation. You’re either buying leadership on a pullback, or shorting weakness as it fails again.
- Buy leader pullback: ratio holds prior breakout level, price forms higher low.
- Buy leader continuation: ratio breaks resistance, price clears a tight base.
- Short laggard breakdown: ratio loses support, price breaks range floor.
- Short laggard retest: ratio rejects prior support, price fails lower high.
Treat the ratio as the trigger and the ETF chart as confirmation.
Exits and invalidation
Your exits must respect how rotation fades. Strength often dies in the ratio first.
- Exit on ratio trend break: close when ratio loses its rising support line.
- Exit on breadth collapse: close if sector advance/decline flips hard for two sessions.
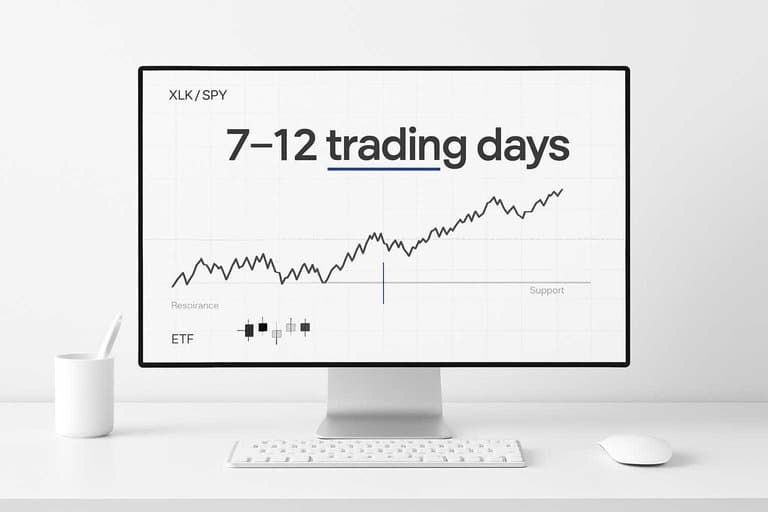
- Exit on time stop: close if no progress after 7–12 trading days.
- Invalidate on failed follow-through: exit if breakout day is fully retraced.
By the time the ETF “looks bad,” the rotation edge is usually already gone.
Hedging beta risk
If you don’t hedge, you’re mostly trading the market’s mood. A simple SPY or ES hedge keeps the bet focused on relative strength, like “XLV beats SPY,” not “stocks go up.”
You can hedge two ways: short SPY/ES against your long sector, or run a pair trade like long the leader and short the laggard. The hedge ratio can be rough, but it must be consistent.
That’s how rotation alpha survives a market headline.
Common failure modes
Sector rotation signals degrade when the market regime changes or your inputs lag. You’ll feel it as “clean charts” that stop following through.
| Pitfall | What’s happening | Early tell | What to do |
|---|---|---|---|
| Chasing late leadership | Mean reversion kicks in | Breakouts fail fast | Wait for first pullback |
| Macro shock overrides | Correlations jump to one | Everything moves together | Cut exposure, reduce bets |
| Overlapping holdings | You’re not diversified | P&L moves as one | Map factor overlaps |
| Rebalance lag | Data is stale | Rankings flip midweek | Shorten lookback, confirm price |
| Liquidity trap | Slippage eats edge | Good signal, bad fills | Trade larger ETFs |
If two or more “early tells” show up, treat rotation as noise until the regime stabilizes.
Mental model takeaway
Sector rotation is just a chain reaction: macro drivers shift, expectations update, and money moves first. Your job is to track that movement weekly, then trade the strongest groups when they confirm.
- Start with macro impulse: rates, inflation, growth, energy
- Translate into expectations: “higher-for-longer,” “soft landing,” “recession risk”
- Watch flows: sector ETFs, credit spreads, dollar, curve steepening
- Measure relative strength: leaders vs SPY, laggards breaking down
- Trigger trades: breakouts, pullbacks, and invalidation levels
If you can’t point to the flow, you’re guessing; if you can, you’re timing.
Turn Rotation Into a Repeatable Weekly Process
- Start with regime first: identify risk-on/off and volatility conditions before you rank sectors.
- Rank sectors with a consistent relative-strength ratio and a matched lookback, then confirm with breadth/volatility context.
- Watch transitions, not just leaders: act when leadership is stabilizing or decisively changing, and stack signals across timeframes.
- Execute with rules: define your entry archetype, invalidation level, and exit plan, and hedge or size to control market beta.
- Review failure modes weekly (chop, crowded trades, proxy mismatch, lookback drift) so the board stays a decision tool—not a narrative.
Frequently Asked Questions
Does sector rotation analysis still work in 2026 with algo trading and passive ETF flows?
Yes—most traders still see rotation because big reallocations (risk-on/risk-off shifts, earnings revisions, rates) move sector ETFs and index weights in waves. The edge usually comes from clean relative-strength trends, not predicting the macro headline.
How often should swing traders update a sector rotation analysis dashboard?
Most swing traders refresh it weekly for positioning and add a quick daily check for regime breaks (big relative-strength reversals, volatility spikes). Updating too frequently often turns normal churn into false “rotations.”
How long does it take for a sector rotation signal to translate into tradable performance?
Typically 2 to 6 weeks for swing trades to reflect a rotation, with many leadership cycles lasting 1 to 3 months before mean reversion or a new catalyst resets them. If relative strength stalls for 10–15 trading days, the rotation often isn’t real.
Can I do sector rotation analysis without using sector ETFs?
Yes—many traders use industry groups, futures-sensitive baskets (e.g., semis, banks, energy), or equal-weight sector indexes to reduce mega-cap distortion. The key is consistent proxies so your relative rankings don’t change because the constituents changed.
What’s a realistic performance expectation from sector rotation analysis for swing trading?
A practical goal is improving win rate and drawdown versus random sector picking, not “beating the market every month.” Many traders target capturing the top 2–3 sectors’ relative outperformance while cutting exposure quickly when leadership breaks.
Turn Rotation Into Watchlists
Sector rotation analysis is only useful when you can measure it daily and translate shifting leadership into a focused, tradable shortlist.
Open Swing Trading delivers daily RS rankings, breadth, and sector/theme rotation context across ~5,000 stocks so you can find breakout leaders faster—get 7-day free access.