
Sector rotation analysis vs relative strength for breakouts
A clear comparison of sector rotation analysis vs relative strength for breakout trading — understand rotation mechanics, RS signal timing, regime-fit use cases, tool/data requirements, and a hybrid workflow with a practical decision rubric.
Breakouts fail most often when you’re right about the chart but wrong about the market’s leadership. The same pattern can explode higher in one regime and instantly fade in another because capital is rotating elsewhere.
This comparison shows you when sector rotation is the better compass, when relative strength is the cleaner trigger, and how to combine both without overfitting. You’ll get concrete pros/cons, data and tools to track, a head-to-head table, and a simple rubric to choose an approach for your next setup.
Decision Snapshot
Sector rotation analysis and relative strength are both momentum tools, but they answer different questions. Rotation asks “where is leadership moving,” while relative strength asks “is this ticker truly leading” before you buy a breakout. Here, a “breakout” means price clears a prior reference level with conditions that suggest follow-through, not a one-bar head fake.
Two approaches
Sector rotation is a top-down read on leadership shifts across groups, like semis taking over from defensives. Relative strength is a bottom-up confirmation that a specific name is outperforming its benchmark, like NVDA beating the S&P 500 before a range break. Use rotation when you trade themes and baskets. Use relative strength when you trade setups and single-name entries.
Breakout context
A breakout is only “real” when the context supports continuation, not just a new high tick.
- Clears a defined level you can mark
- Matches the current volatility regime
- Shows volume or broad participation
- Fits your holding period and chart timeframe
If one of these is missing, you’re trading hope, not a breakout.
Core decision factors
Pick the method that matches your constraints before you optimize signals.
- Set your timeframe and typical hold length.
- Define your universe size and how you scan it.
- Decide how much macro and rate sensitivity you accept.
- Choose signal speed: early rotation or later confirmation.
- Stress-test robustness across regimes and instruments.
Your “best” method is the one you can execute consistently, even on ugly weeks.
How Each Works
Sector rotation analysis starts with the whole market and works down to candidates. You’re measuring leadership migration, like “money leaving defensives for cyclicals.” Relative strength starts with a stock or group and asks if it’s beating a yardstick. You’re measuring who wins the race, not why the pack is moving.
Rotation mechanics
You use rotation to translate broad data into a market posture and a short list. It answers, “Where is risk being rewarded right now?”
- Track sector ETFs versus the index
- Check breadth thrusts and participation
- Measure momentum by timeframe (1W, 1M, 3M)
- Watch flows: volume, fund flows, options
- Classify leaders, laggards, risk-on/off
If defensives lead while breadth fades, your “breakout list” should shrink fast.
Relative strength mechanics
You use relative strength to filter setups by who is outperforming. It answers, “Is this breakout happening in a winner?”
- Compare price vs benchmark (SPY, QQQ)
- Compare vs peers inside the industry
- Plot ratio charts and trendlines
- Rank percentiles over a fixed window
- Require RS holding highs into breakout
If the ratio can’t climb, the breakout is often just noise.
Signal timing
Rotation tends to lead because it catches capital moving before every chart breaks out. You’ll see “industrials improving” while many stocks still look flat.
Relative strength often confirms because it waits for clear outperformance and trend alignment. That’s safer, but it can push you into later entries.
If you want early, use rotation to stalk; if you want clean, use RS to trigger.
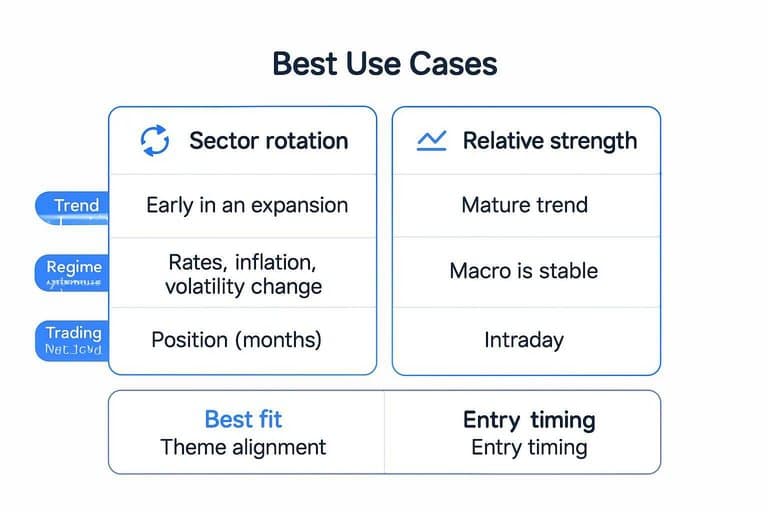
Best Use Cases
Use sector rotation when the “why” behind leadership matters, like rates flipping the winners. Use relative strength when you need a clean “what’s working now” filter for entries. The edge comes from matching the tool to the breakout’s environment.
Trend phases
Early in an expansion, sector rotation often leads because money moves before charts look obvious. In a mature trend, relative strength confirmation cuts false breakouts when leadership starts narrowing.
Rotation shines in:
- New cycle turns after a base
- Fresh leadership with improving breadth
- Quiet breakouts before RS spikes
Relative strength shines in:
- Late-stage trends with crowded leaders
- Breakouts after multiple failed attempts
- Narrow markets where only a few names work
Use rotation to spot the next leaders, then demand RS when the trend gets older.
Regime sensitivity
When rates, inflation, or volatility change, breakouts can be macro puppets. Sector rotation gives you the context for why a breakout should persist, not just pop.
Rotation helps most when:
- Rates trend up or down fast
- Inflation prints surprise repeatedly
- Volatility regime shifts (VIX re-prices)
Relative strength helps most when:
- Macro is stable and trends persist
- Stock selection dominates sector effects
- Volatility compresses and breakouts follow through
If the tape feels “headline-driven,” rotation context is your guardrail.
Trading horizons
Different holding periods reward different signals because leadership changes at different speeds.
| Horizon | Rotation signal | RS signal | Best fit |
|---|---|---|---|
| Intraday | Low value | High value | Entry timing |
| Swing (days-weeks) | Medium value | High value | Breakout selection |
| Position (months) | High value | Medium value | Theme alignment |
The shorter your trade, the more RS matters; the longer your trade, the more rotation compounds.
Pros and Cons
Rotation analysis and relative strength both aim to improve breakout odds, but they fail in different ways. Rotation helps you see where money is going before the chart gets obvious, like noticing Industrials bid while the index grinds. Relative strength keeps you honest, but it can push you into the trade after the easy part.
Rotation upsides
Sector rotation is about riding flows, not just patterns, because breakouts work better with group sponsorship.
- Spot themes before charts go viral
- Spread risk across leading groups
- Catch earlier signals than RS screens
- Align entries with institutional flows
- Filter breakouts in weak groups
If the group is advancing, your breakout has a tailwind instead of a coin flip.
Rotation pitfalls
Rotation tools can lie when breadth is noisy, because leadership changes fast in chop and slow in transitions.
- Get whipsawed in choppy breadth
- Miss shifts from delayed classifications
- Trade ETF noise over real leadership
- Overfit signals to macro stories
- Ignore stock-specific catalysts
When rotation degrades, treat it as context, not a trigger.
RS tradeoffs
Relative strength is a clean confirmation tool because it ranks what is already working, like a stock holding highs while the index fades. It also keeps rules simple, but it can turn you into the last buyer when leaders get crowded.
That’s the line between confirmation and chasing.
Data and Tools
You don’t need fancy data to do rotation and relative strength well. You need consistent inputs and repeatable calculations, or your “edge” becomes a moving target. Treat every metric like a production process, not a one-off chart.
Rotation inputs
Rotation only works if your inputs reflect the trade you’ll actually place. A clean sector set plus a few stability checks beats a dozen noisy indicators.
- Sector and industry total returns
- Equal-weight and cap-weight versions
- Breadth: % above key MAs
- Relative momentum vs benchmark
- Correlations and flow proxies
If your rotation story changes when you flip one input, you have a narrative, not a model.
RS metrics
Relative strength needs one primary metric you’ll trust in real time. Add one sanity check to catch obvious regime breaks.
- Build a price ratio: asset / benchmark.
- Measure slope over a fixed window.
- Convert to percentile rank in universe.
- Compute Mansfield RS or z-score.
- Check rolling alpha vs benchmark.
Pick one to trade, one to question it, and ignore the rest.
Practical toolstack
Your tool choice matters less than your consistency. The goal is identical lookbacks, identical rebalance rules, and the same universe every run.
Charting is fast for context and breakouts. Spreadsheets are fine for small universes and transparent math. Scripting wins when you need versioned rules and repeatability.
Standardize windows and rebalance dates, or your signals will “improve” only because you moved the goalposts.
Head-to-Head Comparison
You’re choosing between two ways to find breakouts: rotate into the strongest groups, or buy the strongest names. The trade-offs show up fast once you compare inputs, timing, and failure modes.
Here’s the clean side-by-side.
| Dimension | Sector Rotation Analysis | Relative Strength (RS) for Breakouts | Best fit when |
|---|---|---|---|
| Primary signal | Sector trend leadership | Stock vs benchmark | You need one trigger |
| Typical timeframe | Weeks to months | Days to weeks | You trade swing breakouts |
| Entry timing | Earlier, before names | Later, at pivot | You prefer confirmation |
| False-breakout risk | Lower, diversified | Higher, single-name | You hate whipsaws |
| Research workload | Moderate, top-down | High, many scans | You have limited time |
Pick rotation when you want a tailwind first; pick RS when you’re paid for precision.
Hybrid Workflow
You don’t have to pick sector rotation or relative strength. Use rotation to decide where to hunt, then RS to decide what deserves capital. Think: “buy leaders in leading groups,” not “buy anything breaking out.”
Top-down screen
Start with the market map, not your watchlist, because breakouts follow sponsorship. Your job is to filter the theme down to tradable names.
- Rank sectors and industries by recent relative performance.
- Exclude groups below a moving RS average.
- Keep leaders with clean trend and volume.
- Filter to liquid names near highs.
- Save a focused breakout list per theme.
You’re reducing randomness before you ever draw a chart line.
RS confirmation gate
A breakout setup is not valid until it leads two races: the benchmark and its peers. That gate keeps you out of “pretty charts” in lagging names.
- Require RS vs benchmark above a minimum rank.
- Require RS vs industry above a minimum rank.
- Confirm RS slope is rising over your lookback.
- Reject names with flat or rolling RS.
- Re-check RS the day before entry.
If RS won’t confirm, you’re trading hope, not leadership.

Entry and risk
Use a simple trigger like a close above the breakout level on higher-than-average volume. Put the stop where the thesis breaks, often below the base low or a key moving average.
Size the position from your stop distance, not your conviction, and cut size if the sector’s RS rolls over. When rotation flips negative, your breakout needs less room and more respect.
For a baseline on what constitutes a breakout in technical analysis, it helps to anchor your trigger and volume rules to a shared definition.
Top-down screen
Start with the market map, not your watchlist, because breakouts follow sponsorship. Your job is to filter the theme down to tradable names.
- Rank sectors and industries by recent relative performance.
- Exclude groups below a moving RS average.
- Keep leaders with clean trend and volume.
- Filter to liquid names near highs.
- Save a focused breakout list per theme.
You’re reducing randomness before you ever draw a chart line.
RS confirmation gate
A breakout setup is not valid until it leads two races: the benchmark and its peers. That gate keeps you out of “pretty charts” in lagging names.
- Require RS vs benchmark above a minimum rank.
- Require RS vs industry above a minimum rank.
- Confirm RS slope is rising over your lookback.
- Reject names with flat or rolling RS.
- Re-check RS the day before entry.
If RS won’t confirm, you’re trading hope, not leadership.
Common Mistakes
You can do clean rotation work and still buy the worst breakout. Most failures come from a few repeatable process errors.
- Chasing the first green candle
- Ignoring weak market regime
- Mixing timeframes without rules
- Buying breakouts into resistance
- Treating RS like a buy signal
Fix your checklist before you change indicators.
Breakout Rules That Match Rotation and RS
Breakouts fail less from “bad indicators” and more from sloppy definitions. The clean way to use sector rotation analysis is to decide what kind of breakout you’re even allowed to trade, then let RS choose the specific name.
Use these rules as a template. They’re intentionally generic so you can adapt them to your market and timeframe.
1) Define the breakout level like you’ll place real orders
A breakout level should be obvious enough that other traders can see it, but specific enough that you can be wrong.
- Use prior swing highs, base ranges, or multi-week highs as the reference.
- Avoid levels that only exist because you zoomed in.
- Prefer levels that were tested (and rejected) more than once.
Rotation tie-in: if leadership is shifting into a sector, you’ll often see more clean bases forming there. If you can’t find clean levels inside the “leading” groups, your rotation read may be early—or the market is still in transition.
2) Require alignment across three layers (market → group → stock)
This is where rotation and RS stop being theory and start being a filter.
- Market layer: the index trend and breadth aren’t actively hostile.
- Group layer (rotation): the sector/industry is a leader or improving vs the benchmark.
- Stock layer (RS): the stock’s ratio vs benchmark (and ideally vs peers) is rising into the breakout.
If you only have the stock layer, you’re trading an isolated story. If you only have the group layer, you’re trading an ETF thesis without a clean entry.
3) Confirm “participation,” not just volume
Volume is useful, but it’s not the only proxy for sponsorship.
- Look for multiple names in the same group tightening and pushing to highs.
- Watch whether pullbacks are being bought quickly (shallow retracements, less time below the breakout level).
- In weak tapes, demand stronger evidence (cleaner base, clearer RS, less overhead supply).
Rotation tie-in: broad participation inside a leading group is often more valuable than a single high-volume print in one stock.
4) Use a failure rule that matches the signal you trusted
Stops work best when they’re tied to the reason you entered.
- If the breakout is a base break, a common invalidation is a close back into the base or under the base low.
- If the edge is RS leadership, an invalidation can be the RS line/ratio breaking down while price stalls.
- If the edge is rotation tailwind, an invalidation can be the sector/industry RS rolling over while the stock hasn’t made progress.
This keeps you from holding a breakout that’s “technically alive” but strategically dead.
5) Plan the retest before you enter
Many of the best breakouts retest. Your process should say what you do if price comes back.
- Decide in advance whether you add, hold, or exit on a retest.
- Don’t let a retest become a new thesis (“it’s a long-term hold now”).
- If you trade fast timeframes, your retest rule should be fast too.
Rotation tie-in: if the group remains a leader during the retest, you’ll often get cleaner second-chance entries. If the group loses leadership during the retest, treat it as a warning that the breakout was timing luck, not sponsorship.
Rubric and Recommendation
You’re choosing between two ways to find breakouts: follow money flows across sectors, or rank leaders by relative strength. The right call depends on your timeframe, your universe, and how much macro noise you can tolerate. Use the checklist to force a decision, then default to the combo when you can.
Selection checklist
Score each row 0–2 for Rotation and RS, then total both columns.
| Constraint | Favors Rotation (0–2) | Favors RS (0–2) | Quick rule |
|---|---|---|---|
| Timeframe | 2: swing/position | 2: day/swing | Longer = rotation |
| Universe breadth | 2: broad baskets | 2: stock lists | Narrow = RS |
| Macro sensitivity | 2: high macro | 1: mixed | Macro-heavy = rotation |
| Automation level | 1: discretionary | 2: systematic | Automate = RS |
| Turnover tolerance | 2: low turnover | 2: high turnover | Fast turnover = RS |
| Validation needs | 1: narrative helps | 2: stats required | Need stats = RS |
If RS wins by two or more, treat rotation as optional context, not a gatekeeper.
Clear recommendation
Use sector rotation for context, then require relative strength for the actual entry trigger. Think “risk-on sector tailwind” plus “this ticker is the leader.”
If you’re forced to pick one method, pick RS for simplicity, speed, and testing. Pick rotation instead when macro is driving everything and correlations spike.
Pick Your Primary Lens, Then Stack the Confirmation
- Start with your breakout context: if leadership is clearly shifting and breadth is uneven, lead with sector rotation; if the tape is broad and trend-following, lead with relative strength.
- Use a two-stage filter: screen for the right sector/industry tailwind (rotation), then require RS confirmation (stock > peers and/or vs benchmark) before you size up.
- Time entries with price, manage risk with regime: enter on your preferred breakout trigger, but tighten/scale faster in choppy, mean-reverting regimes and give more room when leadership and RS align.
- Review weekly, not hourly: rotation is a top-down map; RS is your gate—log which one warned you first and adjust your rubric based on outcomes.
Frequently Asked Questions
Does sector rotation analysis still work in 2026 with AI-driven markets and rapid news cycles?
Yes—sector rotation analysis usually remains effective because capital still moves in waves between sectors, even if the waves are faster. Use shorter refresh cycles (daily/weekly) and confirm with breadth or volume to avoid chasing one-day headlines.
How do I measure whether sector rotation analysis is actually improving my breakout win rate?
Backtest a rules-based version and track breakout-specific stats like win rate, average R-multiple, max drawdown, and time-to-failure versus a baseline that ignores sectors. Most traders also segment results by regime (risk-on vs risk-off) to see when rotation adds the most edge.
What results should I expect from sector rotation analysis for breakout trading?
Most traders see fewer trades but higher average quality—often a modest lift in expectancy (for example, +0.1 to +0.3 R per trade) rather than a dramatic win-rate jump. The biggest benefit is usually avoiding breakouts in sectors with persistent relative outflows.
Can I use sector rotation analysis for crypto or forex breakouts where “sectors” aren’t as clear?
Yes—define sectors as baskets (crypto narratives, FX risk-on vs risk-off groups, commodity-linked vs defensive currencies) and run the same relative-flow ranking on those groups. You’ll get cleaner signals if the basket definitions are rule-based and stable over time.
How often should I update sector rotation analysis for breakout scanning—daily, weekly, or monthly?
Weekly updates work best for most swing breakout traders, while daily updates fit active traders who can handle more noise and turnover. Monthly rotation is usually too slow for breakout timing but can help with higher-level positioning filters.
Find Breakout Leaders Faster
Combining sector rotation context with relative strength can be powerful, but doing it daily across thousands of stocks is hard to sustain consistently.
Open Swing Trading delivers daily RS rankings, breadth, and sector/theme rotation views to streamline your 5–15 minute watchlist workflow—get 7-day free access with no credit card.