What a Trading Day Means for Beginners
An explainer for beginners on what a “trading day” really means—learn the difference between calendar days and market sessions, how open/midday/close shape prices, why trading days vary by market and time zone, what after-hours changes, and how daily charts reflect gaps and resets.
If you’ve ever wondered why a “1-day” chart doesn’t always match what happened in the last 24 hours, you’re running into the difference between a calendar day and a trading day.
This explainer breaks the concept down in plain language: how the open, midday, and close create a daily rhythm, why stocks and crypto don’t share the same “day,” what after-hours trading really changes, and how to read daily candles and gaps without overthinking them.
The Core Idea
A “trading day” is the market’s official open-to-close window, set by an exchange. Your orders, the prices you see, and your risk can shift just because the clock moved.
Think of it like a store with locked doors. You can plan outside hours, but most business happens when it’s open.
Calendar vs market
A calendar day is midnight to midnight. A trading day is whatever hours the exchange declares as its session.
Examples: U.S. stock exchanges run one schedule, futures often run another, and some markets close for local holidays.
If it’s not a session, it’s not a trading day.
Why it matters
Beginner choices change when the trading day changes.
- Place orders when liquidity is deeper
- Read charts using session-based candles
- Track settlement and “T+” timelines
- Prepare for scheduled economic releases
- Respect open and close volatility
Treat the session calendar like a risk tool, not trivia.
Your first takeaway
Use a simple mental model: trading days are scheduled “meetings” where buyers and sellers show up together. That’s when most price discovery happens.
Outside that window, activity can still occur, but conditions often change fast.
Plan your trades for the meeting, not the hallway.
Trading Session Basics
A trading day isn’t one smooth stream of prices. It has phases, and each phase changes how easy it is to get filled near your intended price.
Market hours set the container, but auctions, liquidity, and spreads set the feel. Learn the rhythm first, and many “mystery” losses look a lot less mysterious. It also helps to do your stock selection and market read after the close, when the day’s data is complete—platforms like Open Swing Trading are built around that end-of-day workflow so you’re not making selection decisions in the noisiest parts of the session.
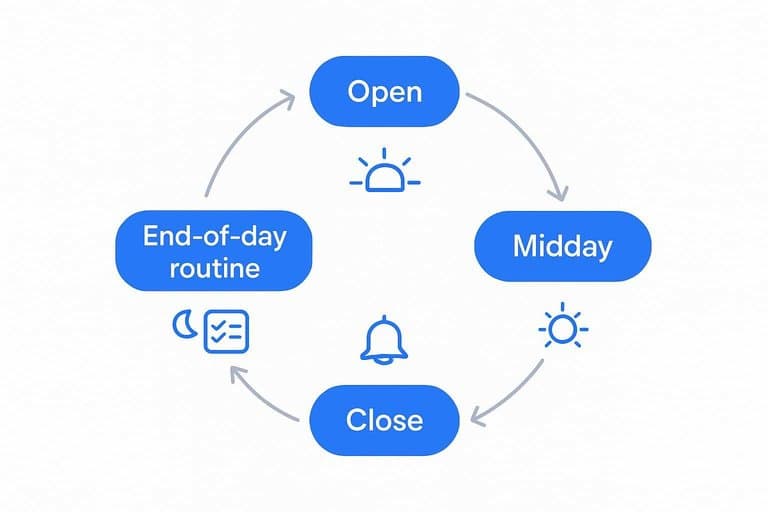
Open, midday, close
Most markets follow a daily rhythm because people and algorithms act in waves. Your fills depend on when liquidity shows up and when it fades.
The typical pattern looks like this:
- Open: Heavy volume, fast moves, wider spreads in some names.
- Midday: Lower volume, smaller moves, thin order books.
- Close: Volume returns, big rebalancing flows, sharper price moves.
If you trade like it’s always midday, the open and close will punish your slippage. One practical way to avoid forcing decisions into those windows is to do the “what should I be watching?” work outside market hours—end-of-day relative strength and breadth snapshots can narrow candidates so you’re not chasing whatever happens to be moving at 9:35.
Auctions and prints
The open and close often use auctions to concentrate orders into one matching event. That can create “jump” prints that look disconnected from the prior trade.
What’s happening under the hood:
- Opening auction: Overnight news and queued orders meet at one clearing price.
- Closing auction: End-of-day positioning and index flows get paired in bulk.
- Last/first prints: Can land outside the mid-session spread you’re watching.
Treat the first and last price as special events, not normal ticks. If you’re building watchlists from daily data, it’s worth remembering that the close includes auction effects—context like market breadth and sector rotation (viewed on completed end-of-day numbers) can keep you from overreacting to a single noisy print. For a deeper look at how this works, see the NYSE opening and closing auctions.
What you can control
You can’t control volatility, but you can control your process. Build habits that reduce rushed decisions and bad fills.
- Check your market’s hours and auction times before placing orders.
- Avoid market orders when spreads are wide or tape is fast.
- Prefer limit orders, and accept that you might not get filled.
- Start with small size until your fills match your expectations.
Control the order, control the risk; the market controls everything else. You can also control when you do your scanning: a short, consistent end-of-day routine (e.g., reviewing relative strength leaders, breadth, and sector strength in 5–15 minutes) makes it easier to place thoughtful limit orders the next day instead of improvising in the open.
Days Aren’t Universal
A “trading day” depends on the venue, the asset, and the rules that venue enforces. Treat it as a calendar and clock you must verify, not an assumption you can reuse everywhere.
Stocks vs crypto
Stocks trade on specific exchanges with opening and closing bells, plus defined premarket and after-hours windows. Crypto often trades continuously, because many venues run 24/7 and don’t use a daily close.
A “session” is an exchange convention for batching liquidity and reporting. It’s not a law of nature.
If your chart has a daily candle, it still reflects a venue-defined cutoff.
Time zones and holidays
Markets can be “closed” for reasons that have nothing to do with your local calendar.
- Weekend schedule for that venue
- Local public holiday on the exchange
- Early close or half-day session
- Unexpected halt, outage, or circuit breaker
Miss one of these and you’ll mistake silence for a signal.
Practical checklist
Do this once per venue, then reuse it.
- Confirm the exchange timezone used for session times.
- Look up the venue’s official holiday calendar.
- Note any scheduled early closes or half-days.
- Set alerts for session start and end times.
Operational awareness beats “I thought it was open.”
After-Hours Trading
After-hours trading is when stocks and ETFs trade outside the regular session, usually in a pre-market window and an after-hours window. Prices can still move because news, earnings, and global markets keep updating expectations, even when the main exchange is closed.
What it is
Extended-hours sessions are the pre-market and after-hours periods when orders match on electronic venues rather than the main open-outcry style session most people picture. Participants often include institutions, market makers, and active retail traders reacting to news, but with fewer orders overall. Liquidity is usually thinner than regular hours, so the next available price can be meaningfully different.
If you see jumpier moves on little volume, that’s not “mystery action.” It’s a smaller crowd. For an overview, see the SEC’s after-hours trading risks.
Key risks
You’re stepping into a market with fewer buyers and sellers, so the mechanics change fast.
- Wider bid-ask spreads
- Bigger overnight price gaps
- Partial fills on limit orders
- News-driven spikes and reversals
- Chart moves that mislead
Treat extended-hours prices as a hint, not a verdict.
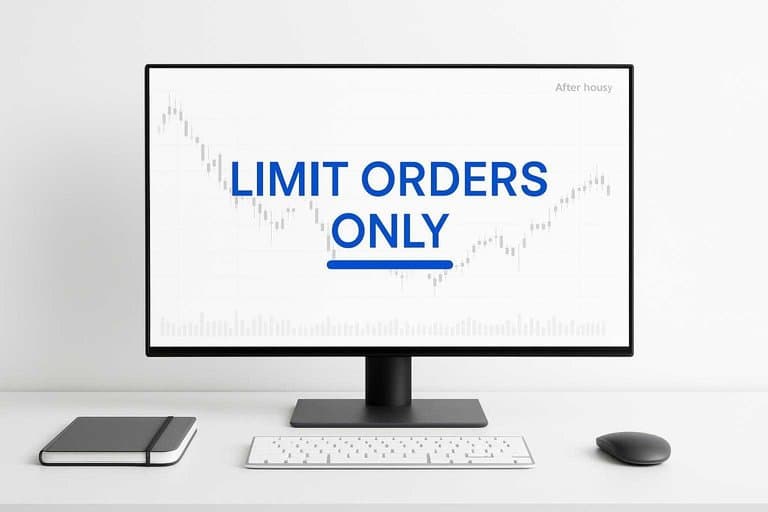
Safe first steps
Start with rules that protect you from bad fills and headline whiplash.
- Watch quotes and prints first, without trading.
- Use limit orders only, never market orders.
- Trade very small size, if you trade at all.
- Skip earnings releases and major news windows.
- Prefer regular hours until your process is consistent.
Your first win is avoiding the “cheap” price that was never actually available.
What Charts Mean
A chart is not “the market.” It’s a record of trades grouped into a trading day. That grouping decides what “today” means, where the close lands, and how indicators behave.
Daily candle logic
Daily candles are built from one session, not from your calendar day. Open, high, low, and close come from the first trade, extremes, and last trade inside that session. So “today” on the chart equals one trading day as your platform defines it.
Gaps and resets
A gap is the space between one session’s close and the next session’s open. It happens when the next trade prints at a new price, with no trades in between. News, order flow, and off-hours trading can all move the next opening print.
Beginner reading habit
Before you compare charts or trust an indicator, check the session definition.
- What session defines each candle?
- What timezone is the chart using?
- Regular-hours only, or extended-hours too?
Use the Trading Day to Set Better Expectations
- Define your market first (stocks, options, futures, crypto) and note its official session times, time zone, and holidays.
- Treat the open and close as “decision points” where liquidity and price discovery often change—plan entries, exits, and alerts around them.
- Be cautious after hours: use smaller size, limit orders, and wider expectations for spreads and sudden moves.
- Build a daily chart habit: ask which session the candle represents, look for gaps/resets, and compare the day’s range to the open/close behavior before you draw conclusions.
Frequently Asked Questions
Is a trading day the same as a business day or calendar day?
No. A trading day is only a day when a specific exchange is open for its regular session, and holidays or special closures can make a “business day” not a trading day for that market.
What counts as the “previous trading day” if there was a holiday or long weekend?
It’s the last session when the market was officially open (the most recent regular trading day), not necessarily “yesterday” on the calendar. Use the exchange’s official holiday calendar to confirm.
Do trading day rules affect settlement like T+1 and when cash is available?
Yes. Settlement and many brokerage deadlines count trading days (exchange-open days), so holidays and closures can push settlement and cash/position availability out by one or more sessions.
Does a trading day matter for stop-loss and limit orders that are “day orders”?
Yes. A Day (DAY) order usually expires at the end of that market’s regular trading day, while GTC orders can persist across trading days until filled or canceled, subject to broker limits.
How do I use the end of the trading day to plan the next session?
Most traders review the close to update watchlists, note relative strength/weakness, and set alerts for the next day’s key levels. If you want a structured post-close workflow, Open Swing Trading is built around daily-after-close relative strength, breadth, and sector rotation views to speed up stock selection without issuing trade signals.
Turn Trading Days Into Plans
Once you understand how sessions, after-hours moves, and chart timeframes fit together, the next challenge is identifying true leaders every day without drowning in noise.
Open Swing Trading updates daily after the close with relative strength rankings, breadth, and sector/theme context so you can build a focused watchlist in minutes—get 7-day free access with no credit card.